Exploring Carnegie’s New 3-Framework System – 2025 Research Activity Designations (Part 1)
The more than 50-year progression of the Carnegie Classification system has led to arguably the largest revision since its inception in 1973 with the recent release of the 2025 Carnegie Classification framework. Through its most recent update in 2021, the “Basic Classification” served as an all-compassing designation for institutions of higher education that recognized institutional characteristics across a combination of features, including degree levels and awards, program focus, and research expenditures.
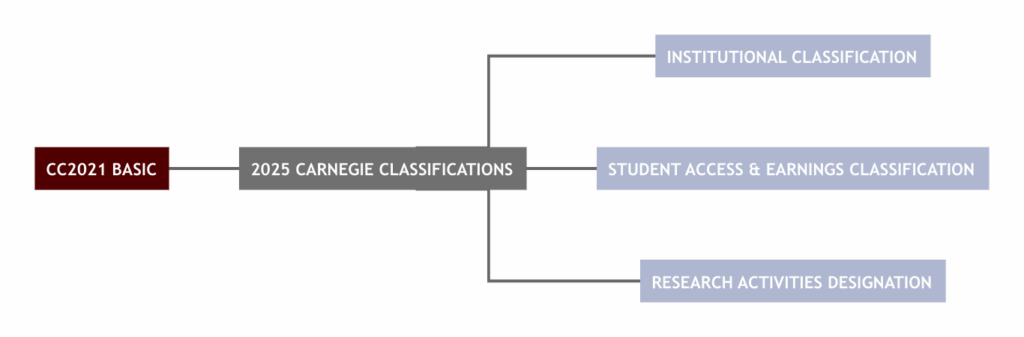
As shown in the flowchart to the left, the new 2025 Carnegie Classifications shift from the single Basic Classification (CC2021 BASIC) to three separate classifications: Institutional Classification, Student Access and Earnings Classification, and Research Activities Designation. The Institutional Classification is a replacement for the previous Basic Classification that relies primarily on enrollment and completions data. A complete listing of the 3,927 institutions with Institutional Classifications can be accessed on Carnegie’s Institution Search page.
The remainder of this post focuses on the new 2025 Research Activities Designations and includes visualizations for each research category. While future iterations will rely only a three-year average, the 2025 Research Activity Designations use the higher of either a three-year average (2021, 2022, 2023) or the most recent single-year data (2023) (Carnegie). For consistency, visualizations below show the three-year average for all institutions, as reporting in the 2025 Research Activity Designation Public Data File.
Research 1: Very high research spending and doctorate production
- Requirements for Research 1 Status: On average in a single year, these institutions spend at least $50 million on research & development and award at least 70 research doctorates (Carnegie Classification of Institutions of Higher Education.
- In the 2025 Research Activity Designations, there were a total of 187 institutions that garnered Research 1 Status. The majority of the Research 1 institutions (145 of 187, or 78%) also held “R1” status (Doctoral Universities: Very High Research Activity) under the 2021 Basic Classification framework. The University of Alabama in Huntsville was the lone R1 from 2021 that did not achieve Research 1 status in the new 2025 Research Activity Designations.
- There were 42 institutions that were classified as Research 1 institutions in the 2025 Designations that were not “R1” in the 2021 Basic Classification. Thirty-two (32) of those were previously “R2” (Doctoral Universities: High Research Activity) institutions in 2021, while 10 were considered “Special focus Four-Year: Research Institutions” under the 2021 Basic Classification framework.
- Of the 16 Texas institutions with Research 1 status in 2025, nine (9) were public universities, four (4) were medical/health science centers, and three (3) were private universities.
- As you can see in the “Research 1 Status” visualization below, Texas A&M University (818 research doctorates and $1.2 billion R&D spending) had the highest combination of values for R1 Texas institutions, followed by the University of Texas at Austin (795 doctorates and $887 million R&D spending).
research 2: high research spending and doctorate production
- Requirements for Research 2 Status: On average in a single year, these institutions spend at least $5 million on research & development and award at least 20 research doctorates (Carnegie Classification of Institutions of Higher Education).
- In the 2025 Research Activity Designations, there were 139 institutions that achieved Research 2 status, compared to 133 institutions with “R2” (Doctoral Universities: High Research Activity) under the 2021 Basic Classification framework.
- Sixteen (16) Texas institutions included in the Research 2: High Research Spending and Doctorate Production group, including 12 public universities, 2 private universities, and 2 medical branch/health sciences centers.
- More than 38 percent (53 of 139) of the Research 2 institutions met one, but not both, of the criteria for Research 1 status. Twenty-seven (27) Research 2 institutions surpassed the threshold for research spending ($50M), but did not have at least 70 research doctorates awarded. In Texas, Texas State University (49 doctorates and $108M spending), UT Medical Branch at Galveston (48 doctorates and $208M spending), and UT Rio Grande Valley (43 doctorates and $48M spending) had research spending above the Research 1 threshold, but did not award enough research doctorates to gain Research 1 status.
- On the flip side, 26 Research 2 institutions awarded at least 70 research doctorates, but fell short of the $50 million in research spending for Research 1 status. Two Texas institutions — TTU Health Sciences Center (85 doctorates and $46M spending) and Texas Woman’s University (155 doctorates and $6M spending) — were included in this group.
- NOTE: Since we are showing the 3-year averages for research doctorates and research spending in the visualization above, there are actually 23 institutions that fell below either the $5M in spending or 20 research doctorates awarded thresholds based on the 3-year average for each metric. However, using the single-year data from 2023 qualified those institutions for Research 2 status. Also, UT Tyler’s average research spending data of $3 million reported in the Public Data File was based on the research spending at the university level, while their Research 2 status was determined based on the inclusion of the UT Tyler HSC’s additional $32M in research spending in 2023 (Carnegie Classification Institution Search).
research colleges and universities
- Requirements for Research Colleges and Universities Status: On average in a single year, these institutions spend at least $2.5 million on research & development. Institutions that are in the R1 or R2 categories are not included (Carnegie Classification of Institutions of Higher Education).
- The Research Colleges and Universities (RCU) group, which is similar to the 2021 Basic Classification of “Doctoral/Professional University,” serves as a way to recognize institutions that meet a slightly lower research threshold with no requirements for research doctorates awarded.
- The RCU is the most diverse collection of institutions, with 22 of the 31 Institutional Classifications (IC2025) in the 2025 update represented. The “Special Focus: Arts and Sciences (43 institutions), “Mixed Undergraduate/Graduate-Master’s Large/Medium” (32), and “Professions-focused Undergraduate/Graduate-Master’s Large/Medium” (31) account for almost half (106) of the 216 RCUs in the 2025 Carnegie Classification system.
- This within-group diversity of the RCU can readily be seen in the visualization above, as the MD Anderson Cancer Center’s $1.2 billion in research spending with zero (0) research doctorates awarded is in the same research classification as Marian University (Indiana) that had just over $1 million in research spending as a 3-year average, but exceeded $3 million in 2023 to qualify for the RCU designation.
- Six universities in Texas that were classified as ‘Master’s Colleges & Universities” in the 2021 Basic Classification and did not qualify for previous research-related designations benefited from the new 2025 Research Activity Designations: West Texas A&M University ($10M), Saint Edward’s University ($4.8M), Texas A&M International University ($4.6M), Sul Ross State University ($3.9M), Stephen F. Austin State University ($3.4M), and the University of Texas Permian Basin ($3.3M).
So What?
When the Carnegie Foundation and the American Council on Education (ACE) announced their partnership in 2022, the organizations set out to “develop new and refined versions of the Classifications to better reflect the public purpose, mission, focus, and impact of higher education” (Carnegie and ACE). Replacing the Basic Classification schema that spanned the Carnegie Classification’s existence since 1973 with the three-part classification system is designed to “provide a number of ways to consider the higher education sector that aim to prompt conversations about how different types of colleges and universities are serving students and how they are operating in today’s context” (Change: The Magazine of Higher Education).
While the Institutional Classifications and the Research Activity Designations embody components of the previous version of the Carnegie Classifications, the “new kid on the block” is definitely the “Student Access and Earnings Classification” system, which was developed as a “framework for classifying institutions based on the types of students they serve and the economic outcomes that students experience” (SAEC Classification Methodology). We will explore this new element of the Carnegie Classifications in our next blog post, highlighting where Texas institutions were classified in terms of student access and earnings as conceptualized in the new Carnegie Classification system.