Using IPEDS Outcome Measures to Explore Graduation Rates in the United States

Throughout the course of modern higher education in America, any discussion regarding student success (retention/persistence rates and graduation rates) has primarily involved a single group: first-time, full-time, degree-seeking students. Data reporting at the federal (Integrated Postsecondary Education Data System [IPEDS]) and state (Texas Higher Education Coordinating Board [THECB]) levels have used this group that enrolls in the fall semester of each academic year as cohorts that are then tracked over time. The retention, persistence, and graduation outcomes for the first-time, full-time, degree-seeking cohorts serve as the primary measures of success for student outcomes against which institutions, systems, and states within the higher education sector are compared.

IPEDS Outcome Measures: Expanding Our Knowledge Regarding Student Success

  • Source: https://nces.ed.gov/ipeds/use-the-data/survey-components/11/outcome-measures

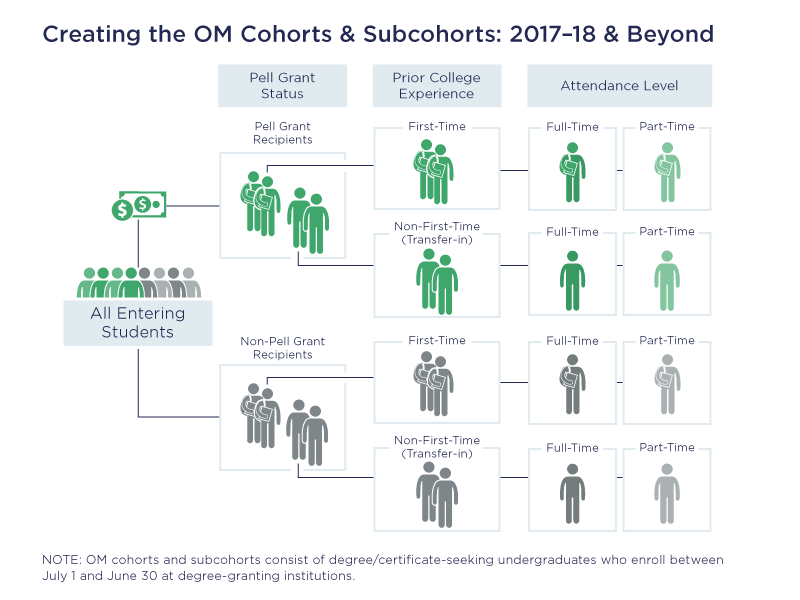
Starting with the 2014-2015 IPEDS reporting cycle, institutions began reporting enrollment and award data that extended beyond the first-time, full-time, degree-seeking cohorts. Deemed Outcome Measures (OM), all degree-seeking students entering at any point during an academic year between July 1 and June 30 at degree-granting institutions are included in the OM cohorts. As shown in the graphic to the right, the 2017-2018 reporting cycle included three subcohort categories: Pell Grant Status, Prior College Experience, and Attendance Level. This multifaceted way of reporting means that students who were previously overlooked in terms of student outcomes are now being systematically tracked at multiple time-points (4, 6, and 8 years) related to the completion of an award (e.g., degree, diploma, certificate, or other recognized credential conferred by the institution). The OM cohorts and subcohorts now allows for the evaluation of how institutions of higher education, including both 2-year and 4-year institutions, are doing in terms of promoting student success for all undergraduates enrolled on their campuses.

Due to the fairly recent development and inclusion of the OM data in the IPEDS data universe, only three cohort years with all three cohort categories have been reported by institutions. With institutions determining graduation status up to 8 years after entry, the 2011-2012 cohort is the most recent data we have to explore the new outcome measures. Data for all 4-year public institutions in the United States were queried using the IPEDS online data tool. The following analysis includes only institutions with Carnegie classifications of baccalaureate colleges, master’s colleges and universities, and doctoral universities.

FIRST-TIME-IN-COLLEGE (FTIC) STUDENTS

The first visualization below combines all three of the OM categories in a single chart that shows each of the time-points for graduation status, comparing Pell recipients with Not Pell recipients across each of the variable and time-point combinations. Graduation rates (4 Years, 6 Years, and 8 Years) are calculated across all institutions, regardless of Carnegie classification. The six pairs of bars on the left-hand side of the chart show the graduation rates for First-Time-In-College (FTIC) students, broken out by full-time versus part-time, and Pell versus Not Pell. The subcohort of FTIC and full-time students is functionally identical to the first-time, full-time, degree-seeking cohorts traditionally used to calculate graduation rates. The primary difference between the traditional and OM cohort methods is that the OM cohorts are formed across an entire academic year, while traditional cohorts are fall enrollment only. 

In comparing the Pell versus Not Pell students, a trend becomes readily apparent. Regardless of variable combination, students who receive Pell grants graduate at a lower rate than those who do not receive Pell grants. The gaps are more significant for the FTIC students, especially for full-time students, than for transfer students. Beginning at the far left, the 4-year graduation rate for FTIC, full-time, Not Pell students nationally was just under 42% for the 2012 OM cohort, while the Pell students had a graduation rate just below 24%. That 18 percentage point difference holds fairly steady as you move to the 6-year graduation rate (64.2% for Not Pell and 45.8% for Pell) and 8-year graduation rate (66.4% for Not Pell and 48.8% for Pell) time points. Another striking difference for FTIC student population is how great the gap is between full-time and part-time students. By the end of the 8-year graduation rate calculation, FTIC, Not Pell students who started as part-time students had a graduation rate of 22.1%, while the Pell students in this subcohort were at a 13.9% graduation rate. These rates are over 44 percentage points lower than the full-time students for the Not Pell group, and almost 35 percentage points lower than the part-time students in the Pell group.

TRANSFER STUDENTS

Moving to the right-hand side of the visualization, we see the data for the Transfer student population. As previously discussed, transfer students have been largely overlooked in the national landscape of measuring student outcomes. In the IPEDS OM data, a transfer student is defined as “A non-first-time degree/certificate undergraduate student (who) is new to your institution, but has prior postsecondary experience. This term will most likely refer to students who transferred-in during the entry year of the cohort. Transfer-in students may enter with or without credit” (NCES).

One of the biggest takeaways can be found when comparing Transfer students to FTIC students. Generally speaking, Transfer students out-perform FTIC students across subcohorts. When comparing each combination of variables between Transfer and FTIC students, the closest gap is for full-time, Not Pell students at the 8-year graduation mark: 68.6% for Transfer students and 66.4% for FTIC students. Larger gaps can be seen for Transfer students with Pell grants, as full-time Transfer Pell grant students have a 61.6% graduation rate at 8 years compared to full-time FTIC Pell grant students’ 48.8%, while the gap for part-time students is almost 30 percentage points (42.7% for Transfer students and 13.9% for FTIC students) after 8 years.

While gaps remain between full-time and part-time transfer students, the gaps between Pell and Not Pell within each transfer subcohort based on attendance level at enrollment (full-time versus part-time) are much smaller than in the FTIC cohort. For full-time Transfer students, there is a 7 percentage point gap between Not Pell (68.6% at 8 years) and Pell (61.6% at 8 years) students across the three OM graduation time points. Part-time Transfer students trail the full-time transfer students in terms of graduation rates by approximately 24 percentage points (68.6% for full-time versus 44.6% for part-time) for Not Pell students at the 8-year graduation rate checkpoint, with part-time Transfer students with Pell grants (42.7%) about 19 percentage points below their full-time Transfer Pell grant counterparts (61.6%). Within the part-time Transfer subcohorts, the gap between Not Pell and Pell is less than 2 percentage points (44.6% and 42.7%) after 8 years of enrollment.

Identifying Differences by Institution Type Using Carnegie Classification

While the differences between Transfer and FTIC students, as well as Pell and Not Pell students exist in the overall data shown above, we also wanted to explore whether differences in these groups existed across the various types of institutions included in the public 4-year college and university IPEDS datasets. As shown in the visualization below under the column heading “Carnegie Class,” there are three levels of doctoral institutions (Very High Research Activity, High Research Activity, and Doctoral/Professional Universities), three levels of Master’s colleges and universities (Larger Programs, Medium Programs, Small Programs), and two levels of bachelor’s colleges (Arts & Sciences Focus and Diverse Fields) within the Carnegie Classification system.

To promote exploration of these data, we have included a series of filters on the right of the bar chart that will allow you to select different combinations of variables to view Outcome Measures data in a variety of ways. By default, the visualization is set up to show 6-year graduation rates for FTIC students who were full-time upon entering their institution in the 2011-2012 academic year. This subcohort is similar to the traditionally-defined first-time, full-time, degree-seeking fall enrollment cohort which is most often discussed within higher education.

FTIC STUDENTS

As you can see on the bars on the right-hand side of the chart, gaps remain between Not Pell and Pell students, regardless of institution type. The top two rows show graduation rates for Not Pell and Pell students at Doctoral Universities with “Very High Research Activity.” Based on the Carnegie Classifications definitions, institutions in this highest classification award at least 20 research/scholarship doctoral degrees and have at least $5 million in total research expenditures annually. These institutions are also known as “R1” institutions, and in Texas include the likes of Texas A&M University, University of Houston, University of North Texas, and the University of Texas at Austin. In the national data below, just over 75% of FTIC, full-time, Not Pell students earn a bachelor’s degree from their initial university of enrollment within 6 years. For Pell grant students in that same subcohort, that 6-year graduation rate drops to just below 63%. Even though the gap between Not Pell and Pell students is over 12 percentage points in this Carnegie Classification, the Pell grant students at the “R1” institutions have a higher 6-year graduation rate than any other subcohort for FTIC, full-time students in the other seven Carnegie Classification institution types.

TRANSFER STUDENTS

If we select “Transfer” students from the Entry Status filter at the right, the visualization expands to show Transfer students who were full-time at the point of enrollment. Focusing on the Transfer students at the bottom half of the visualization, we see similar patterns to the overall Transfer data above. Students who transfer to doctoral institutions in the “Very High Research Activity” classification have the top 2 6-year graduation rates for all Transfer student subcohorts (74.2% for Not Pell and 68% for Pell students), closely followed by the Not Pell Transfer students at Master’s: Larger Programs at 66.6%. The gaps between Pell and Not Pell status students who Transfer as full-time students are much smaller than in the FTIC full-time cohorts, which is the same trend shown in the overall data above.

FTIC vs TRANSFER STUDENTS

While not as easy to compare the Carnegie Classification institutions visually across FTIC versus Transfer cohorts, we can still see that Transfer students fair very well when compared to their FTIC counterparts at the same institution type. In general, full-time Transfer students out-perform full-time FTIC students in terms of both Pell and Not Pell status, with Transfer Pell grant recipients at several institution types having graduation rates higher than FTIC Not Pell student groups at that same Carnegie Classification level. If you select “Part-Time” under the “FTPT” filter at the right, you can even more clearly see that students who Transfer as part-time students have much higher levels of success than FTIC, part-time students across all institution types. For more discussion regarding FTIC versus Transfer outcomes, see the “So What?” section below.

NOTE: If you are unable to read all of the labels in the visualization below, we recommend clicking the “Full Screen” button on the lower right of the visualization window to enlarge the information.

So What?

The findings presented above may be a surprise to some readers new to discussions about Transfer student success when compared to FTIC students, especially when the analysis is controlling for institution type, enrollment status at entry (full-time versus part-time), and Pell grant status (Pell versus Not Pell). These data typically are touted by strong proponents of transferring as the preferred pathway to 4-year institutions.

While the data do seem to support this perspective, there are caveats that need to be addressed. When comparing FTIC and Transfer students, (as a colleague once said) we are comparing “apples and carburetors,” as the typical FTIC student and the typical Transfer student are often qualitatively different individuals. Historically speaking, FTIC students enter 4-year institutions with little to no college-level experience. Even though dual credit enrollments of high school students have certainly expanded in recent years, those experiences remain relatively disconnected in terms of the types of freedom and responsibilities that a newly-enrolled 18-year-old who is living on her own for the first time will experience. Contrast this FTIC student with a Transfer student who may enter a 4-year institution as a junior. This student will most likely be older, have more life experience, and have had academic successes at another institution after high school. To say that comparing these students is an “apples to apples” comparison is not always realistic.

What would be a more equivalent comparison between FTIC and Transfer students who enter 4-year institutions is to create cohorts based on students’ “rising” level of classification in a particular year of interest. While the Outcome Measures data certainly are a step forward in subcohort comparisons, there is no reasonable way at this point to use IPEDS data to, for example, create cohorts of FTIC students who become classified as juniors in an academic year to compare with Transfer students who enter as juniors that same year. At a local level, however, we can create these types of cohorts. In a recent analysis of A&M System institutions, we determined that FTIC students who had risen to be classified as juniors during FY2013 had a higher 4-year graduation rate (85%) than Transfer students who entered A&M System institutions as juniors (68%) during FY2013. The 4-year time-frame for juniors is roughly equivalent to a 6-year graduation rate that is typically used for first-time, full-time, degree-seeking cohorts. Although this is just one example of how to create these cohorts, by controlling for “rising” or “incoming” classification status for FTIC and Transfer students, we can create a common starting-point for both FTIC and Transfer students that allows for more equivalent comparisons.

Leave a Reply

Your email address will not be published. Required fields are marked *