
Persistence and Retention: The Texas Perspective
As a follow-up to the last blog post that reviewed persistence and retention data at the national level, this post focuses the analytical lens on public universities in Texas. The following definitions will be used in the discussion below:
- Retention rate is measured by the percentage of students who return to the same institution for their second year.
- Persistence rate is measured by the percentage of students who return to college at any public four-year institution in Texas for their second year.
- For Texas data, only first-time, full-time, degree-seeking students were included in the calculations for retention and persistence, as has been customary for state and federal reporting.
There were a series of takeaways from the national data review:
- The overall retention rate across all institution types was 81% as of fall 2018.
- The overall persistence rate at public four-year institutions was 84.7%, with more than 88% of full-time students persisting to the second year at some university.
- Retention rates differed widely by institutional selectivity, ranging from 55% at private for-profit that are open admissions to 97% for highly-selective institutions (less than 25% admission rate), regardless of institutional control (public or private nonprofit).
- Full-time students (79.2%) persisted at a rate approximately 28 percentage points higher than part-time students (51.6%) at public 4-year institutions.
With these national trends providing the backdrop, the remainder of this blog post looks at both retention and persistence rates at public universities in Texas.
Longitudinal Trends: Statewide, Systems, and Universities
STATEWIDE
The first tab (STATEWIDE) on the visualizations below shows the statewide trends for both retention (taller blue segments) and persistence (full height of bars) spanning 2015 to 2019 for four-year public universities in Texas. Reading left-to-right, we can see that the retention rate for all institutions in the fall 2015 cohort was 77.5% and was 80.1% in the 2019 cohort, representing a 2.6 percentage point increase in five years. The overall persistence rate dropped slightly from 87.9% in 2015 to 87.6% in 2019. However, the 2019 cohort persistence rate is an improvement over the previous two years in 2017 and 2018.
While students are being retained at a higher rate at their originating universities, the overall decrease is due to a smaller percentage of students transferring to other Texas public universities and persisting to the second year at the new university. This percentage, shown in the gray bar and labeled, “Persisted at Other,” shows that 10.4% of the students who persisted from the 2015 cohort did so at a different Texas public university from which they started. While there had been a decline occurring through 2018, the fall 2019 cohort saw a larger drop down to 7.51%. For students in the 2019 cohort, their second term (spring 2020) was directly affected by the COVID-19 pandemic shutdowns and sudden shifts to online learning environments. While purely speculative, one of the possible explanations for this downward shift in “Persisted at Other” could be the effect of COVID-19 on students’ transfer patterns. Historically, higher education has seen a portion of students who initially moved farther away from home for their first year of college subsequently transfer to institutions closer to home for their second year of college. Due to the prevalence of online instructional modes extending the fall 2020 semester, these students had the option of remaining at home and continuing enrollment at their original university. This change in transfer patterns may have contributed to increasing retention rates at universities while lowering the rate of students persisting at other institutions.
SYSTEMS
The SYSTEMS tab shows the same data as in the STATEWIDE tab, but aggregated at the public university system level. The color-coding schema remains the same, with the blue segment representing retention rates, the gray segment representing students who transferred and persisted at another public university in Texas, and the number at the far right is the overall persistence rate. Data for 2015 and 2019 are shown to make comparisons over time, as the systems are ordered by overall persistence rates for the fall 2019 cohort. At the top is the Texas Tech University System (TTUS) with an almost 91% persistence rate, which exceeded the University of Texas System’s (UTS) 90.1% persistence rate. To provide context, the TTU System had just under 7,400 first-time, full-time, degree-seeking students enrolled in fall 2019 at its system institutions (Angelo State University and Texas Tech University), while the UT System’s 8 member institutions had over 28,000 first-time, full-time, degree-seeking students in fall 2019. In analyzing the retention rate patterns from 2015 to 2019, all six of the public university systems, plus the group of public independent institutions, saw positive growth in their percentages of students who stayed at their original campuses into their second year. The highest percentage point increase was within the UT System, which saw a 4.04 percentage point growth in retention rates during that time frame. As shown in the STATEWIDE data, the “Persisted at Other” group (gray bar) shows a drop for each of these system groups from the 2015 to 2019 cohorts.
UNIVERSITIES
The UNIVERSITIES tab shows just a single-year snapshot for the fall 2019 cohort, due to the relative stability of retention and persistence rates over time. The bars are ordered by highest persistence rate to lowest persistence rate by campus. The range of rates goes from UT Austin’s 97.9% at the top to Texas Southern University’s 57.8% at the bottom. There is one university that has a fairly large representation of students who persist at other institutions when compared to their overall persistence rates: Texas A&M University-Corpus Christi (TAMUCC). TAMUCC has a close affiliation with Texas A&M University (TAMU) in College Station, by which students initially enroll at TAMUCC, with the option of transferring to TAMU to continue their academic pursuits.
Retention Rate Trends by Institutional Selectivity
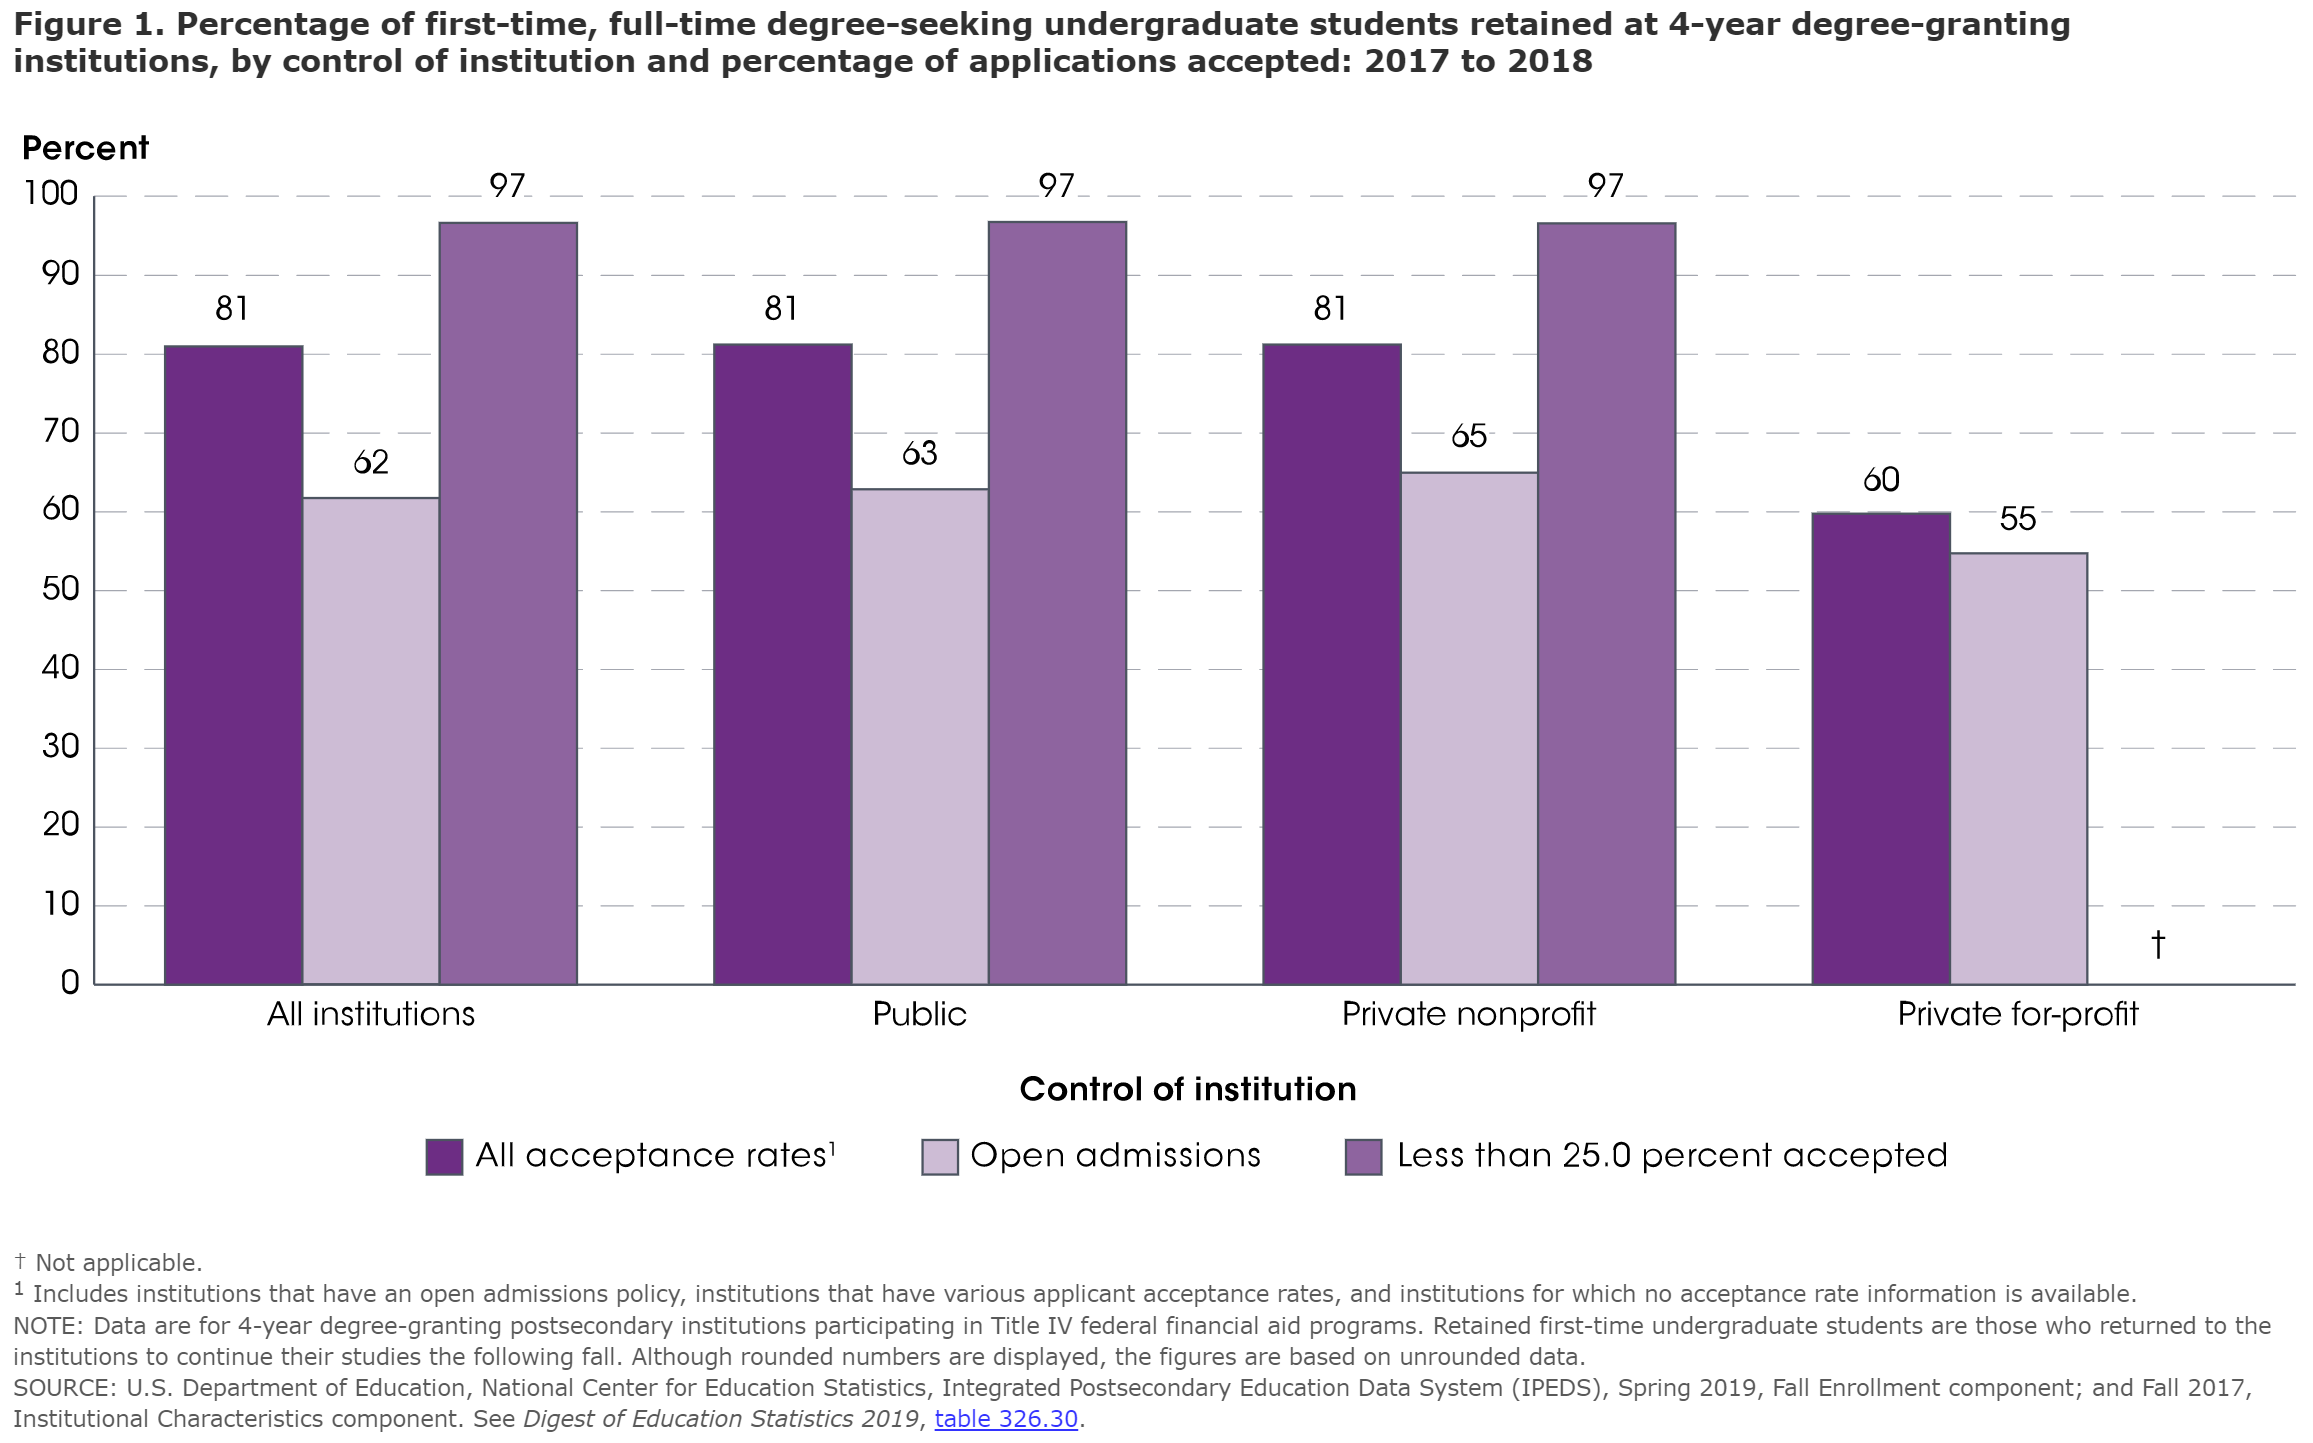
One of the interesting, albeit not unexpected, findings from the National Center for Education Statistic’s (NCES) The Condition of Education report was the wide variation in retention rates based on level of selectivity. In the figure to the right (labeled Figure 1) from the NCES report, we can see that the overall retention rate across all institutions, at public 4-year institutions, and at private nonprofit 4-year institutions, was the same at 81%.
When factoring in institutional selectivity, we also see similarities across institution types. As part of the reporting process to NCES’s Integrated Postsecondary Education Data System (IPEDS), campuses have to respond to the question: “Does your institution have an open admission policy for all or most entering first-time undergraduate-level students?” Institutions who respond “Yes” are classified as “Open admissions” institutions. Institutions who respond “No” to this question provide data on the numbers of applicants, admissions, and enrollees in order to determine campus-specific acceptance and enrollment rates. The “Open admissions” and “Less than 25.0 percent accepted” categories included below the “Control of Institution” heading in the visualization to the right show the extremes of the “admissions selectivity” continuum, as opposed to showing all levels of selectivity between open enrollment and most selective institutions. For “Open admissions” institutions, retention rates were in the low-to-mid 60 percent range, while the most selective institutions (“Less than 25% accepted”) were at 97% retention.
In order to better understand retention patterns at public universities in Texas, admissions data from the THECB’s 2020 Texas Public Higher Education Almanac were joined to the retention rate data for each public university in Texas. While there are no “open admissions” public universities in Texas, there remains quite a range in the level of selectivity across the state. Using admissions data for the fall 2019 first-time, degree-seeking cohort, the most selective institution was UT Austin with an admission rate of 33.9%. While the lowest rate for public universities in the state, that percentage would not place UT Austin in the most selective category in the IPEDS figure shown above that had a cut-off of 25% or less. The least selective public 4-year institution in Texas was UT El Paso, which had a 100% admission rate in fall 2019, but is not considered an “open admissions” university for reporting purposes.
Due to the more restricted range of admission rates within Texas public universities, we could not replicate the methodology used by NCES to report institutional selectivity by percentage cut-point bands (i.e, less than 25%, 26%-50%, open admissions, etc.). In order to “bin” institutions into groups for comparisons, the institutions were ordered by admission rate and quartiles were calculated based on the range of admission rate values. Institutions with the lowest admission rates were classified as “Most Selective,” with the highest admission rate group labeled “Least Selective.” As you can see in the “SELECTIVITY (AVGS 2019)” chart below, the average admission rate for the Least Selective group of institutions was 89.7%, with the Less Selective group averaging an 82.1% admission rate, the More Selective group averaging a 78.9% admission rate, and the Most Selective group averaging a 62.6% admission rate.
The bars in the chart below represent the Average Retention Rate by selectivity group. This chart shows a similar trend to the national data included in the NCES figure above, in that as institutions become more selective, their retention rates improve. While not as dramatic as the difference between open admissions public universities (63%) and less than 25% accepted public universities (97%) in the NCES chart, there is an improvement in retention rate moving left to right on the bar chart below, as evidenced by a 10.2 percentage point difference in average retention rate when comparing the least selective and most selective institution groups. The middle admission rate quartiles are very similar in average retention rates across the universities in these two groups. NOTE: Hovering over the bar with your mouse-based cursor, or clicking on the bar with a touch-based interface, will show a tooltip that includes the public universities that are in each selectivity quartile, as well as each institution’s retention rate for the fall 2019 cohort.
Under the “SELECTIVITY (UNIVERSITIES)” tab, you will find a comparison of admission rates (x-axis) and retention rates (y-axis) for all of the public universities in Texas that admit first-time-in-college students. The size of each dot on the scatterplot is based on the number of applications that institution received from first-time, degree-seeking students for fall 2019 admission. The color of each dot shows the university’s affiliation with one of the six public university systems in Texas, with the public independent universities grouped together. Hovering over each university shows additional information of interest. The simple linear regression line running through the scatterplot shows the same pattern as discussed in the selectivity quartile analysis, mainly that as institutions become less selective in their admissions standards, their retention rates drop.
So What?
In general, one of the biggest takeaway from the multiyear analysis of retention and persistence trends at public universities in Texas is that we have not collectively moved the needle to increase student persistence in the last five years. Out of the fall 2015 cohort, 87.9% of students persisted to their second year, while 87.6% of the fall 2019 cohort persisted. This means that the same 12-13 percent of students who were not persisting five years ago are still not persisting. So while universities have improved retention rates during this five-year span, the overall persistence rates have actually fallen slightly.
Based on the comparison of admission and retention rates above, a knee-jerk reaction might be to conclude that all institutions should simply raise their admissions standards in order to increase their retention rates. While this is certainly a strategy that institutions can employ, and generally-speaking, there are some institutions across the country that have done so, it could be argued that the commonly-held mission of public 4-year universities is to provide access to educational opportunities for all of the citizens of Texas who meet the particular entrance requirements established across the various public universities in the state. As we consider these and other issues related to student outcomes, it is vital that we maintain a balanced perspective on interpreting the data in order to make informed decisions that will promote improved outcomes for all of the students we educate across Texas.