
Persistence and Retention: The National Perspective
While the past few blog posts have specifically addressed enrollment trends in Texas public universities, this blog post will begin a multi-part series of posts that will look at student outcomes data. We will begin by looking at the national trends associated with persistence and retention before moving to a Texas-centric view of those initial outcomes measures that most people associate with student success. Graduation outcomes will be the next topic that will be explored, which will be followed by post-graduation employment outcome data from the US Census Bureau.
One of the challenges when reviewing national trends is that the data are often more than an academic year behind the current year of schooling. Therefore, the data we will be exploring are “current” as of either fall 2018 (National Center for Education Statistics (NCES)) or fall 2019 (National Student Clearinghouse (NSC)). However, given that persistence and retention patterns are difficult to change in the short-term at a national scale, it is safe to postulate that the trends seen for the previous decade are likely to hold true through the fall 2020 semester, with the possible exception of COVID-19 specific effects.
Before diving into the data, we must first establish our definition of terms. The following definitions will be utilized throughout our discussion, as stated in the NSC’s most recent Persistence and Retention report:
- Persistence rate is measured by the percentage of students who return to college at any institution for their second year.
- Retention rate is measured by the percentage of students who return to the same institution.
Trends Across Institution Types and Selectivity
When conversations regarding student outcomes occur, they are most often just focusing on the first-time, full-time degree-seeking undergraduate students who enroll in the fall semester of a given academic year. While not the focus of this blog post, in order to contextualize persistence/retention patterns, a brief review of data is helpful. According to the NSC Research Center, there were total of almost 2.6 million first-time enrollees during the fall 2018 semester across all institutional levels (2- and 4-year), with approximately 82% of enrolled as full-time students. At four-year public institutions, almost 90% of the 1.1 million first-time incoming students were full-time during their first semester. Based on data available through the Texas Higher Education Coordinating Board’s (THECB) Interactive Portal, between 92% and 95% of first-time degree-seeking students have historically enrolled as full-time students across public universities in Texas. With 9 out of 10 first-time degree-seeking students enrolled as full-time, it makes sense that these students comprise the cohorts analyzed when calculating student outcomes.
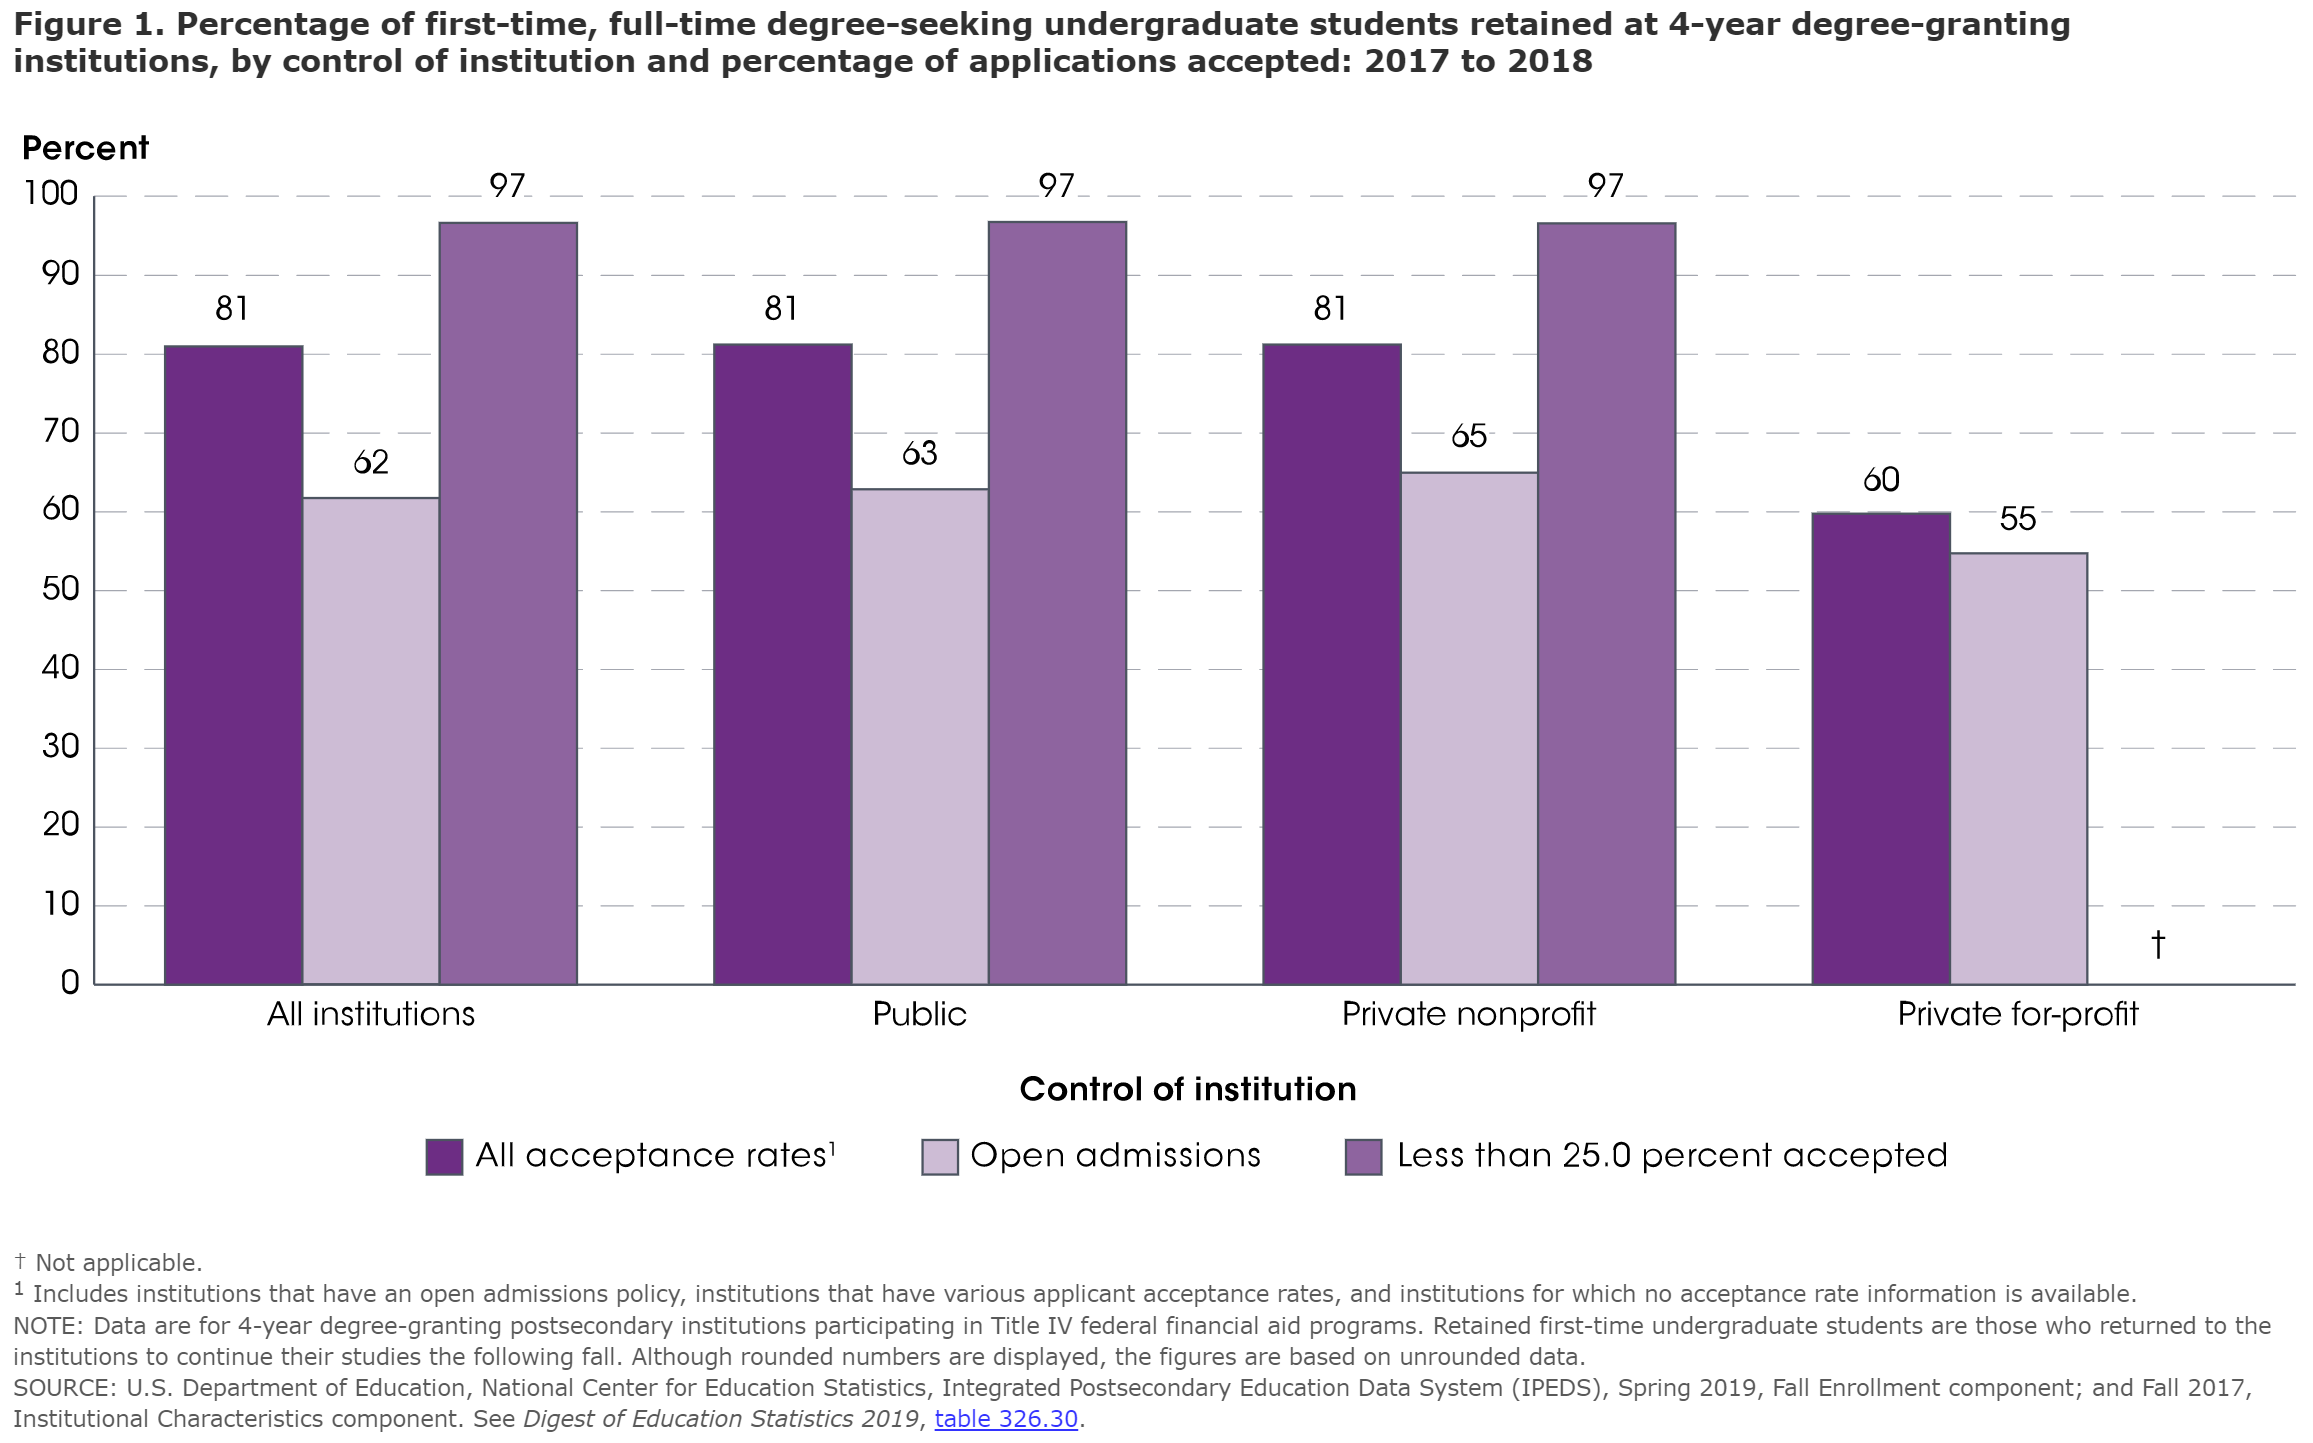
The first visualization below is included in the NCES’s most recent The Condition of Education report and disaggregates first-year retention data by control of institutions (across the x-axis) and percentage of applications accepted (color-coding of bar segments). Looking at the far left set of bars, percentages above the bars show that the overall retention rate (students returning to the same institution for their second year) for first-time, full-time degree-seeking at 4-year institution was 81% for the fall 2017 cohort. The other two bars in the “All institutions” cluster show that 62% of the cohort enrolled at “open admissions” institutions retained to the second year, while 97% of students at more selective universities were retained from 2017 to 2018. Interestingly, these trends basically hold true across public and private nonprofit institutions, while dropping-off significantly for private for-profit institutions.
NOTE: As part of the reporting process to NCES’s Integrated Postsecondary Education Data System (IPEDS), campuses have to respond to the question: “Does your institution have an open admission policy for all or most entering first-time undergraduate-level students?” Institutions who respond “Yes” are classified as “Open admissions” institutions. Institutions who respond “No” to this question provide data on the numbers of applicants, admissions, and enrollees in order to determine campus-specific acceptance and enrollment rates. The “Open admissions” and “Less than 25.0 percent accepted” categories included under the “Control of Institution” heading in the visualization below appear to be used to show the extremes of the “admissions selectivity” continuum, as opposed to showing all levels of selectivity between open enrollment and most selective institutions.
Trends by Enrollment Intensity Over Time
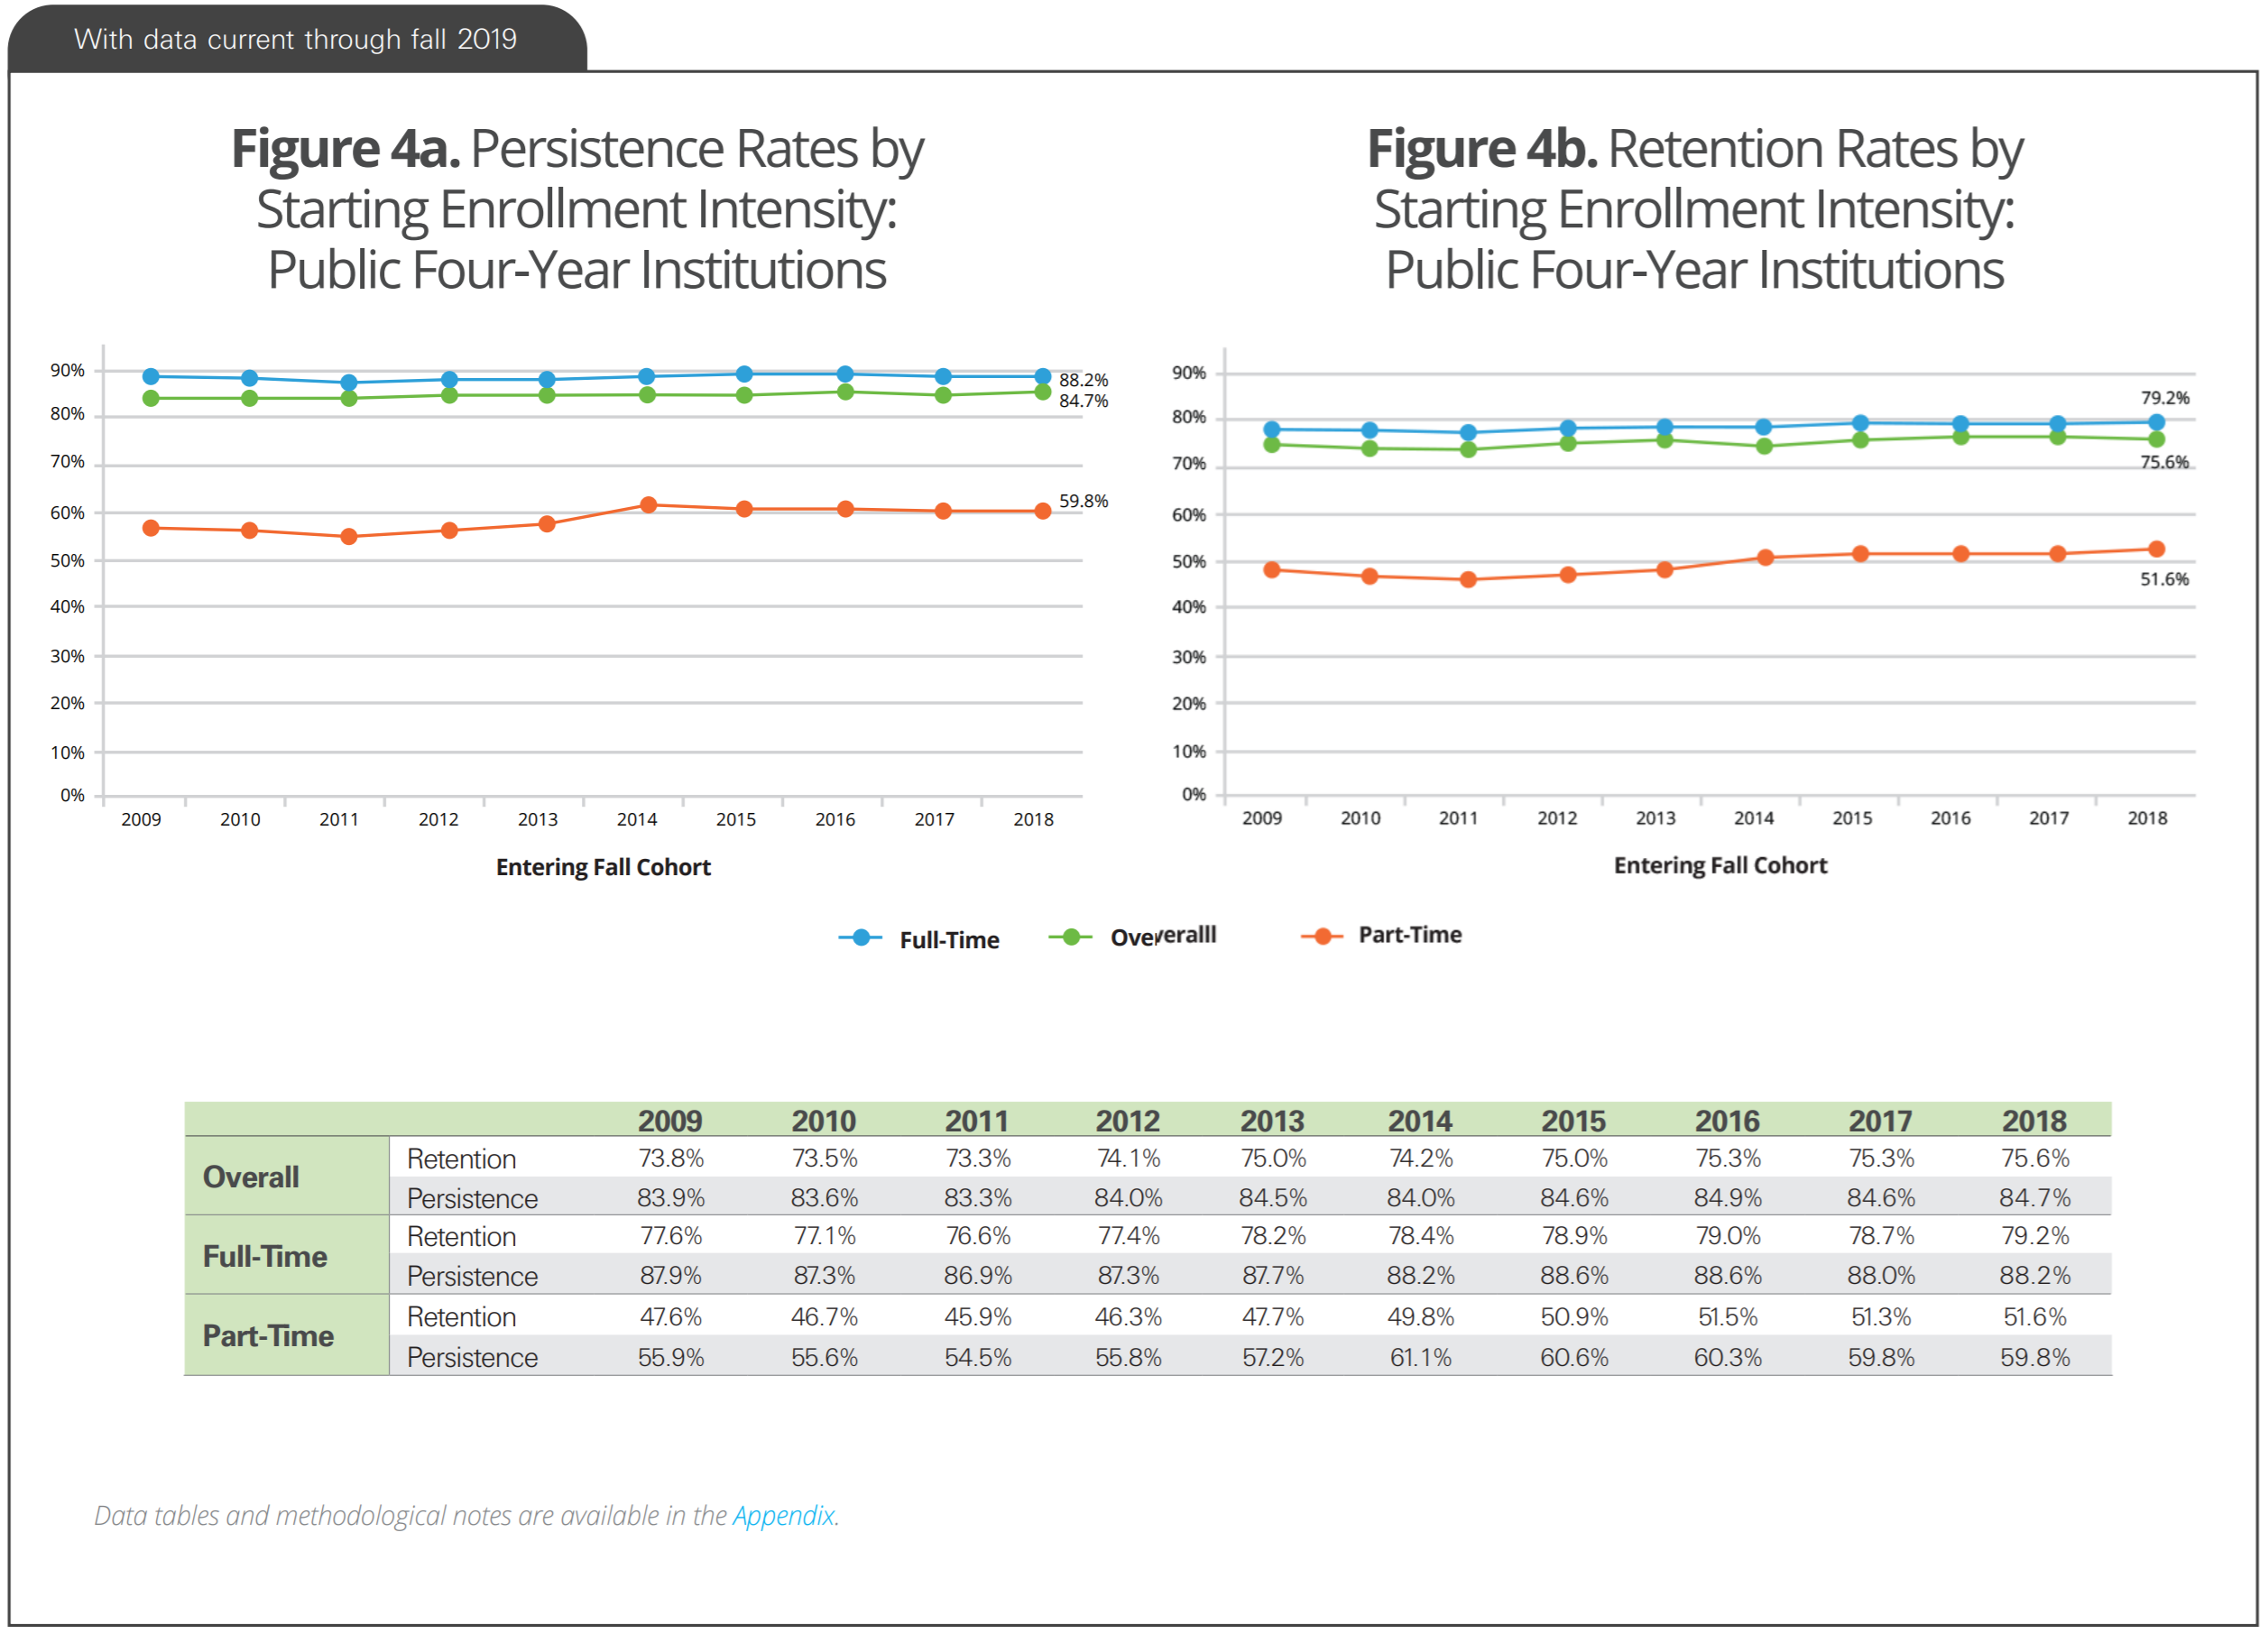
In addition to the NCES shown above, the NSC’s Research Center has published longitudinal data in its First-Year Persistence and Retention Snapshot Report. Showing fall cohort data from 2009 to 2018, the report provides estimated data for both retention and persistence rates across institutional types, by enrollment intensity, and by race/ethnicity groups. The most direct comparison to the NCES’s fall 2017 snapshot data above can be seen in Figure 4b on the right side of the visualization below. While not exactly an identical calculation, the top line shows that full-time students enrolled at four-year public institutions had an estimated 79.2% retention rate in the NSC data, as compared to the 81% calculated by the NCES. Based on the table below the charts, the first-year retention rate for full-time students at public four-year institutions ranged from a low of 76.6% in 2011 to a high of 79.2% in 2018.
The value added by the NSC data is that we can compare trends over time in both retention rates and persistence rates (percentage of students who return to college at any institution for their second year) by enrollment intensity. For retention rates at public four-year institutions, part-time students (51.6% in 2018) returned for a second year at a rate almost 30 percentage points lower than their full-time counterparts (79.2% in 2018), with the overall retention rate increasing from 73.8% in 2009 to 75.6% in 2018. Shifting to Figure 4a on the left, the persistence rate for full-time students was 88.2% and for part-time students was 59.8%, while the overall rate was 84.7% in 2018. Based on the slopes of the lines and the values in the table, the persistence and retention rates have remained relatively flat for the past decade across institutions nationally.
Trends by Race/Ethnicity (Fall 2018 Cohort)
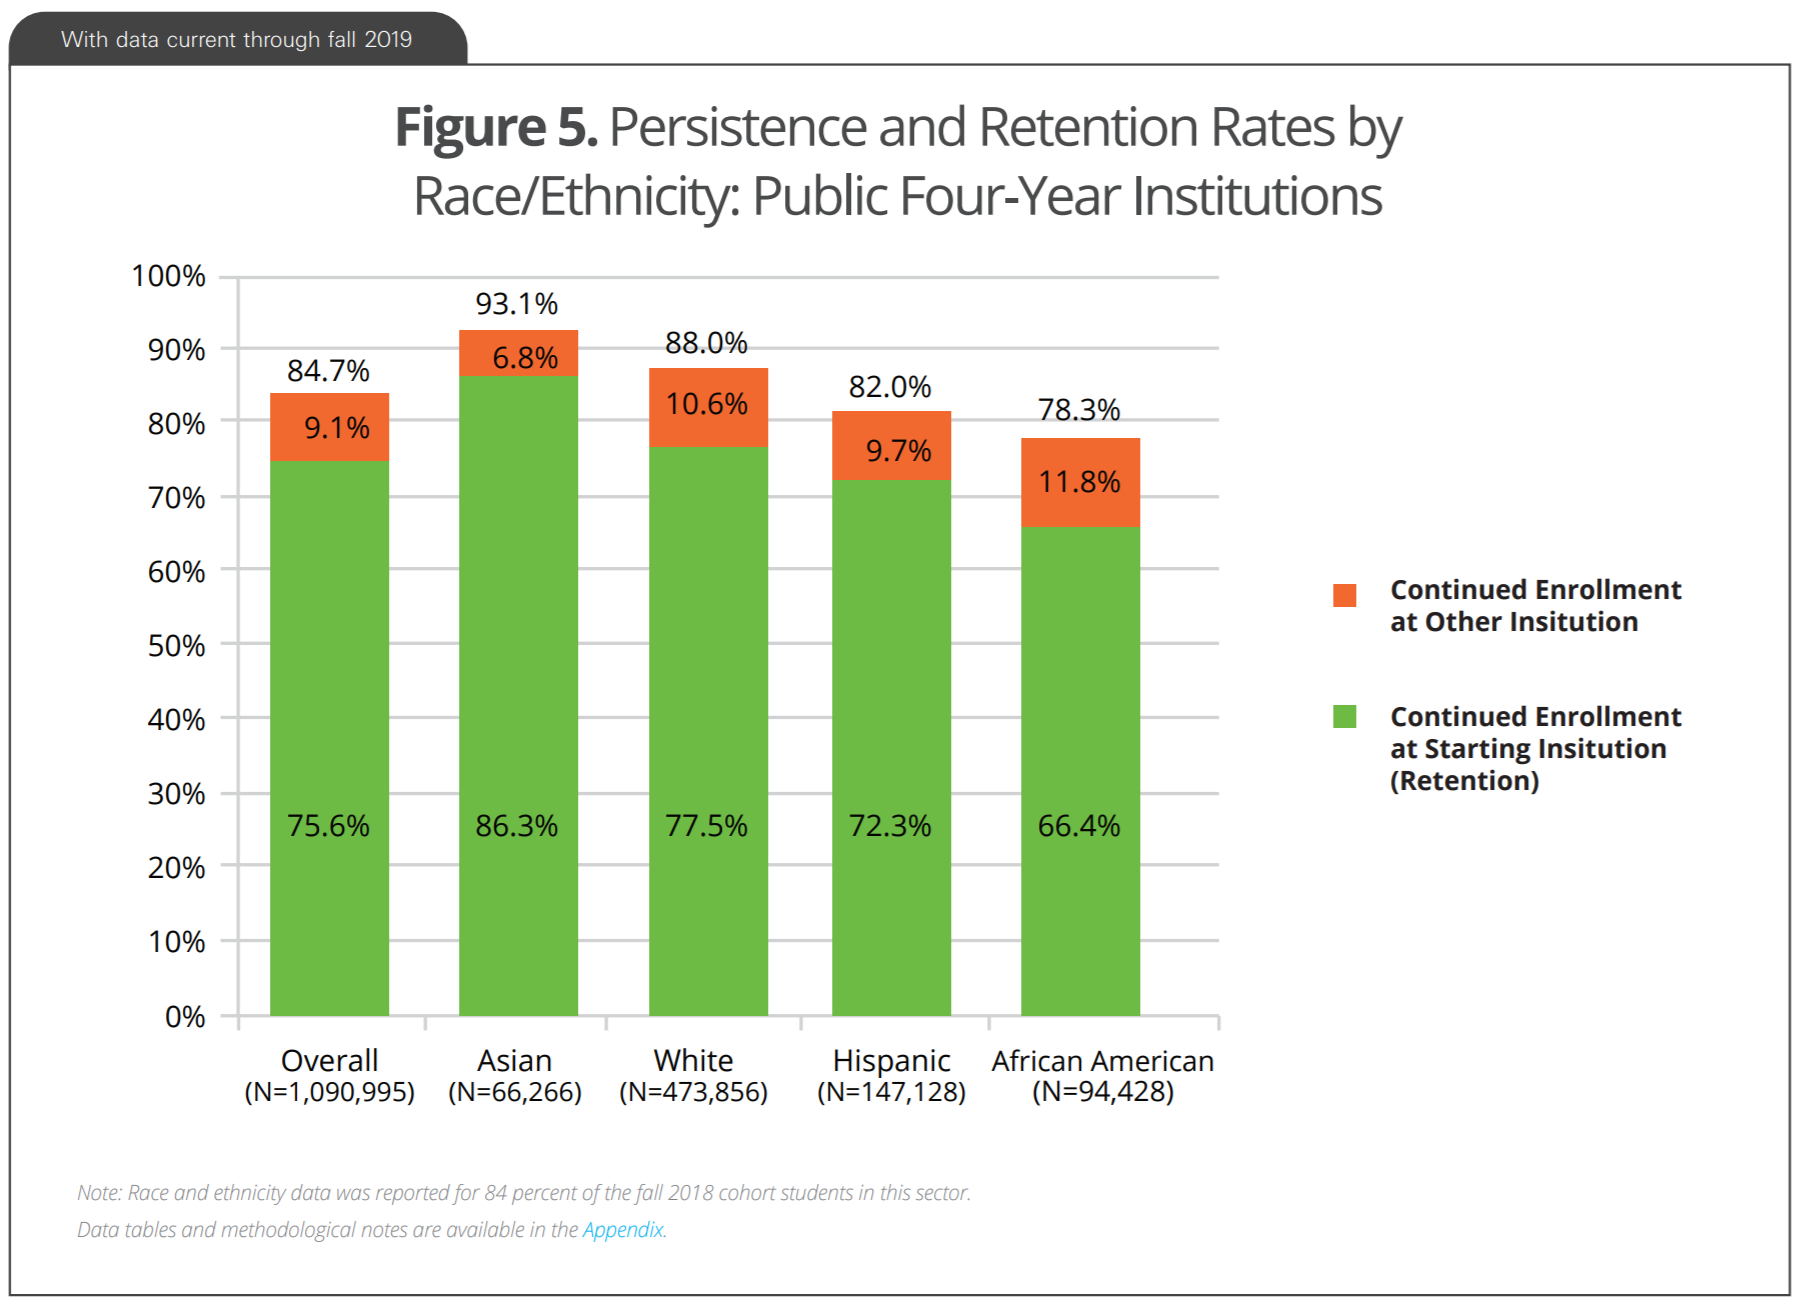
In addition to the longitudinal trends presented in the NSC Report, one-year snapshots are provided that show persistence and retention rates by race/ethnicity categories for all students, regardless of enrollment intensity. Across the bottom of the chart, we can see that the fall 2018 first-time degree-seeking cohort consisted of 43.4% White students, 13.5% Hispanic students, 8.7% African American students, and 6.1% Asian students. Note that these percentages do not add up to 100 percent, as there are other race/ethnicity categories that comprise the overall total of 1.1 million students.
The lower portion of each bar represents the retention rate, while the total height of the bar is the persistence rate for each category. Starting at the far left, the overall retention rate was 75.6%, with an additional 9.1% persisting at another institution, which increased the overall persistence rate to 84.7%. The race/ethnicity categories are presented in descending order of persistence rates.
- Asian students persisted at a 93.1% rate, with 86.3% of Asian students retained at the starting institution.
- White students persisted at an 88% rate, with 77.5% of White students retained at the starting institution.
- Hispanic students persisted at an 82% rate, with 72.3% of Hispanic students retained at the starting institution.
- African American students persisted at a 78.3% rate, with 66.4% of African American students retained at the starting institution.
These data show that there is an equity gap in persistence nationally between Hispanic students and White students of 6 percentage points, and 9.7 percentage points between African American students and White students, with the gap between Asian students and White students at 5.1 percentage points.
So What?
Success in higher education can be framed in many ways. From an academic affairs perspective, one of the most oft-cited mechanisms for determining institutional quality or success has been an incoming cohort’s retention/persistence rate. One of the findings from the NSC’s longitudinal data shown above that bears consideration is the percentage of first-time, full-time degree-seeking students who persisted to the second year at another institution averaged 9.2% between fall 2009 and fall 2018 nationally. In 2009, the difference between the full-time retention and persistence rates was 10.3 percentage points, while that gap narrowed to 9 percentage points in 2018. During this span, the retention rate for full-time students increased from 77.6% in 2009 to 79.2% in 2018, an increase of 1.6 percentage points. By comparison, the full-time persistence rate grew 0.3 percentage points from 87.9% to 88.2% during the same span of time. What this seems to indicate is that universities are slightly improving in their ability to keep students at their institution to the second year, and are seeing a smaller percentage of students who persist doing so at another institution through transfer. This upward trend, albeit small in nature, is a positive signal for four-year institutions moving beyond fall 2019 in order to see what effects COVID-19 has had on student retention and persistence at a national level.